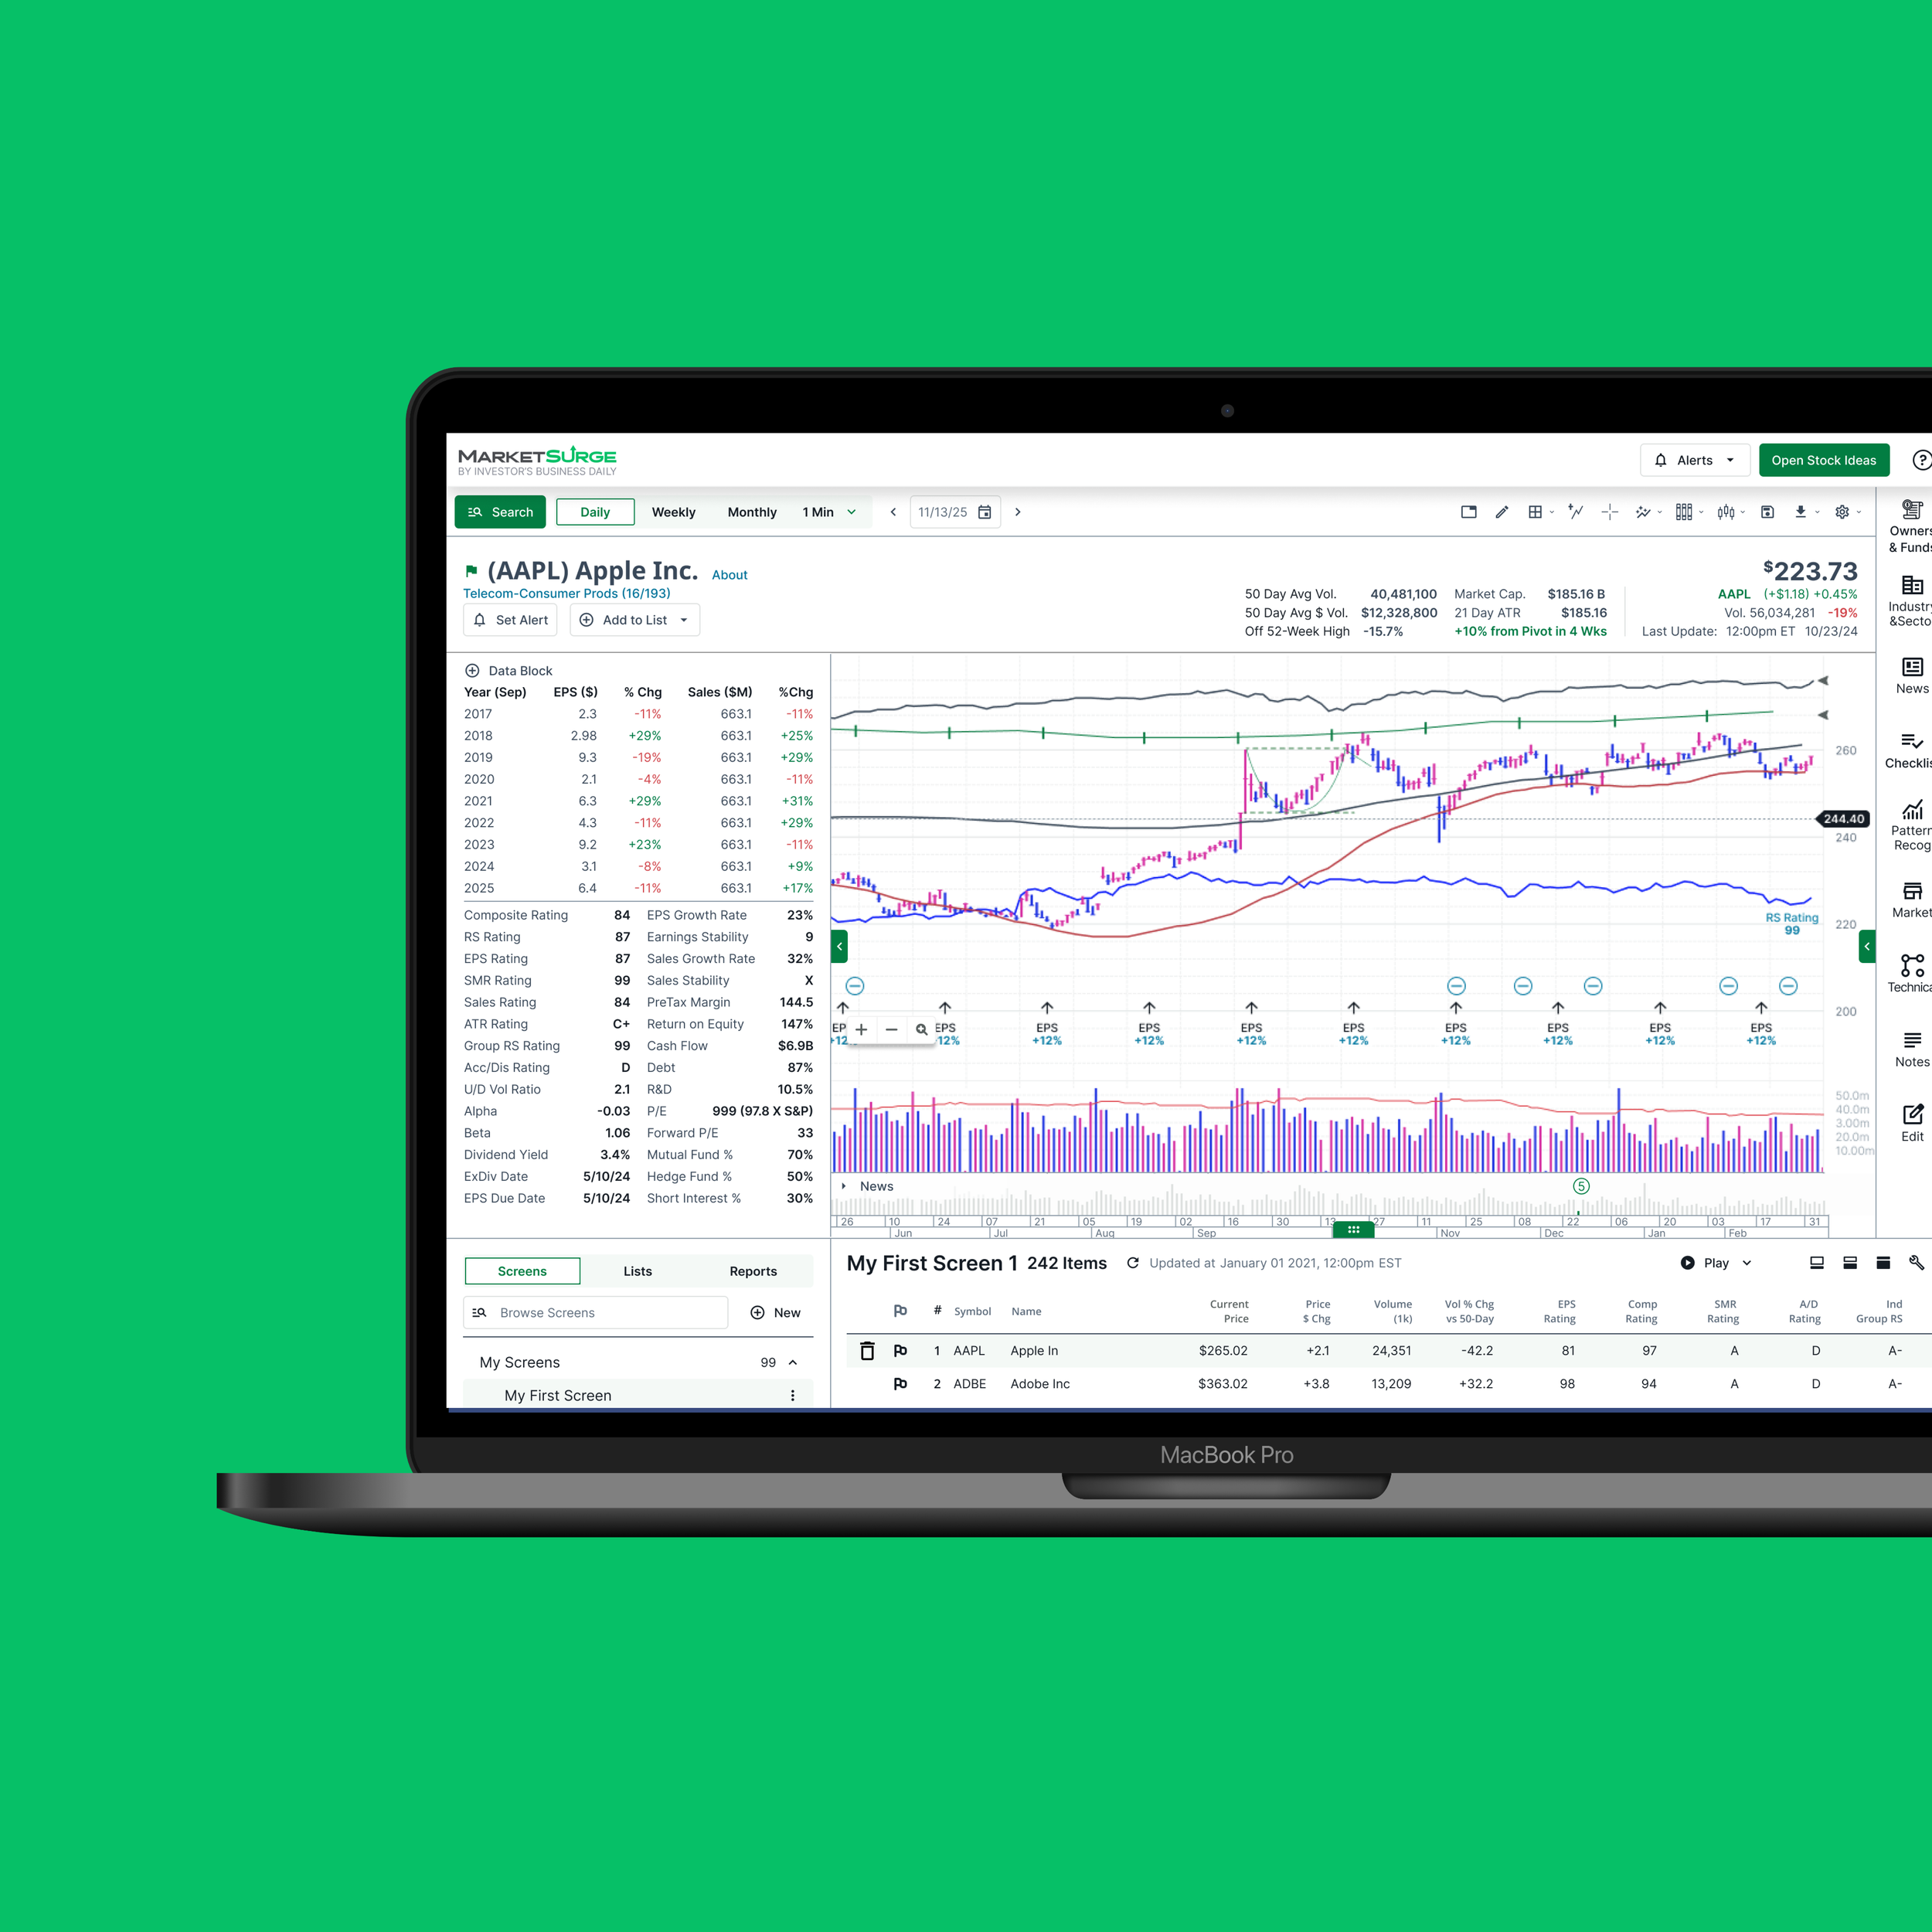
MarketSurge is the flagship interactive charting and stock research platform from Investor’s Business Daily (IBD) (a Dow Jones / News Corp company).
It was launched as the modern successor to MarketSmith, built around the CAN SLIM growth investing methodology pioneered by IBD founder William O'Neil. It provides technical and fundamental analysis tools geared toward active growth stock traders and swing traders.
Key Features:
Proprietary 1–99 Ratings: Includes IBD's exclusive metrics—such as Composite Rating, EPS Rating, and Relative Strength (RS) Rating—which compress complex data into simple numerical scores to evaluate stocks against the broader market.
Automatic Pattern Recognition: Uses algorithms to identify classical technical chart patterns (e.g., cup-with-handle, flat base, double bottom) and color-codes clear buy, profit-taking, and stop-loss zones on interactive price charts.
Curated Growth Lists: Offers access to screens like the Growth 250, IBD 50, and specialized indicators (like the David Ryan "Ants Indicator") to highlight institutional accumulation and high-potential growth stocks.
Fundamental & Technical Integration: Overlays quarterly earnings trends, sales data, and institutional sponsorship directly onto interactive price and volume charts.
Stock & ETF Screener: Contains customizable criteria to filter thousands of stocks using technical indicators, fundamental metrics, and IBD ratings.
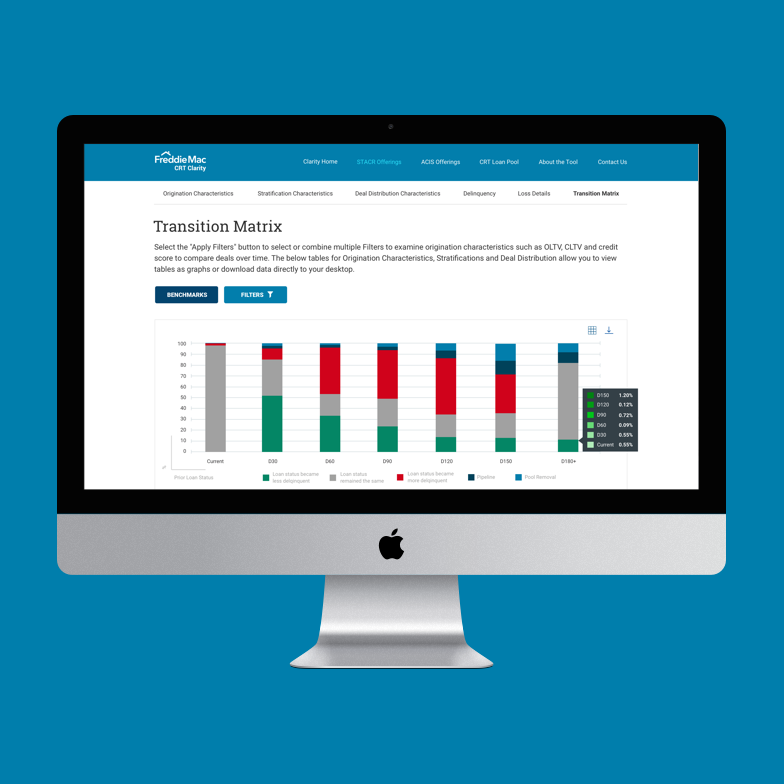
Freddie Mac CRT Clarity gives you visibility into Freddie Mac Credit Risk Transfer. This tool gives you a wide range of possibilities for organizing, viewing and working with Freddie Mac CRT data. Use preconfigured filters to examine Origination and Performance characteristics, and easily export and download data to your desktop.
ECO is a Market Intelligence Ecosystem Designed for Mortgage Professionals. Data is useful only if we can see what it means. Freddie Mac created ECO so mortgage professionals can evaluate performance, compare their performance to competitors’ and optimize lending strategies. ECO turns valuable mortgage market data into insightful visualizations. ECO’s data visualizations bring performance indicators to life within the context of maps, benchmarks, and thresholds. It uses geotagged data and digital mapping to spot opportunities and analyze performance by market across the United States.